Misc Projects : Meter Reading With a Webcam
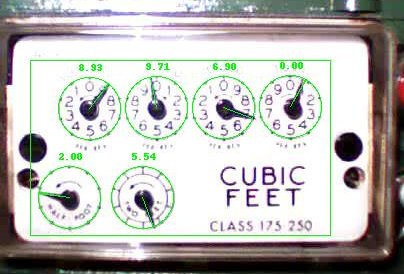
The goal of this project is to read a standard 6-dial analog natural gas meter. Data is captured using an inexpensive USB webcam, and processed (minimally) using Python. As I would like to be able to measure the amount of gas used on a minute-to-minute basis, directly reading the dials on the meter (by eye or computer) does not provide enough precision. That is, the finest enumerated dial reads increments of 1000 cubic feet, more than is consumed over several cold winter days. To get around this, rotations of the lower test dials are counted over successive images, and calibrated to correspond to overall.
For some time, I have had a great interest in home environmental and utility monitoring. Naturally, this leads me to monitoring temperature, electrical and water consumption, and, now, natural gas utilization. I don't, however, have the commensurate budget to purchase meters and sensors typically used by industry. Perhaps I am as interested seeing what can be made by tinkering with what I've got.
I should note that all of this tinkering lies far outside of my formal training, so don't trust your life to any results...
Hardware
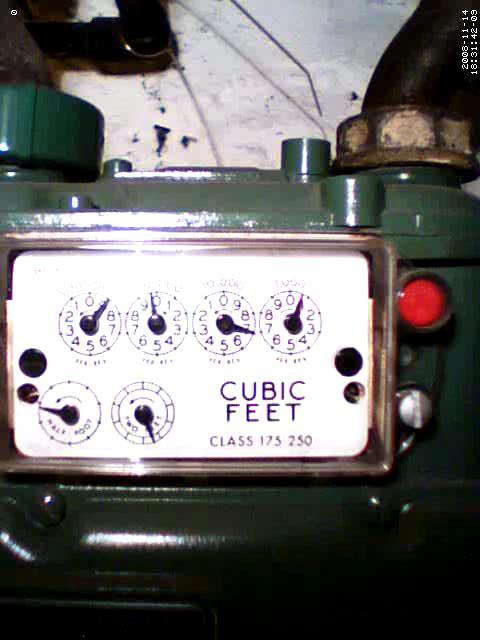
Image acquisition is accomplished using a low-quality VGA webcam. Images from this camera are compressed at low quality, have poor color balance, have significant noise, and tend to be out of focus, no matter how it is adjusted. Unfortunately, the field of view is also rather wide. Nonetheless, one must consider that little information is needed to extract the position of each dial, so low-quality will do. With my current positioning, a 22-pixel radius centered at each dial is used for extraction.
The gas meter in my home happens to be mounted inside the basement, allowing easily controlled lighting, and a secure camera mount. Early on, I decided I could more easily construct a sturdy mount than write code to cope with a moving camera. A fixed light is positioned to achieve consistent lighting, day and night. I've tried to keep equipment at a minimum, and physically separated from the meter, to avoid ire from the man who reads the meter.
Image Feature Extraction
As input, I assume a fixed face-on image, with the center coordinates of each dial manually annotated. Currently, no image registration is performed to automatically align dials, and all feature extraction is performed per-image rather than across images.
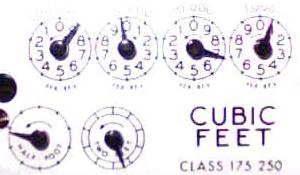
Dials are processed one at a time. First, the requiste region is cropped from the full captured image. Then, this region is equalized, a threshold is applied, and a simple mode-filter is applied. For better visibility of the process, I have included an inverted image below. Lighting does vary some across the captured field, or equaliation could be applied once to the full dial region.
Here's an actual image of all dials, followed by processing of the 1000 cu. ft dial:
 |
||||
| Raw Dial Image | ||||
 |
 |
 |
 |
 |
| 1 Crop |
2 Equalize |
3 Threshold |
4 Filter Noise |
5 Invert Image |
We need then to determine the angle of each needle, on each dial. Several approaches were attempted. First, one might consider linear regression on the pixels of each dial, assuming the dial will dominate the image. Unfortunately, image noise, varied background, and shadows produce too many artifacts. Knowing that we expect to see a line extending from the dial center to the edge, another approach is to try to fit such a line to the image, stopping at greatest overlap. While better, this approach is often confounded by shadows at the dial center, which is disproportionately affected due to the bulged shape of the needle.
A final approach was to fit a pie shape to the needle, where the narrow point is aligned to the dial center, and larger portion at the radius. This is performed by iterating a black pie shape around the image, and noting the position which obscures the most white pixels (on the inverted image). The logic of this choice of shape can be reasoned from the idea that the tip of the needle is far more informative than the center, so we would like to emphasize its weight over the needle center. The center is very affected by any shadows, and would otherwise play too great a weight in determining the able.
Test images illustrating the procedure are as follows:
 |
 |
 |
 |
|
| Angle, and number of remaining white pixels: | ||||
| 0, 775 pixels |
42, 734 pixels |
287, 721 pixels |
294, 700 pixels |
|
Since this extraction procedure worked flawlessly for my purposes, I took what friends would label as an uncharacteristic approach, and stopped refining. Subtracting the dial background would likely improve angle determination and remove any bias for positions over larger (by area) digits. Further, it is likely that a supervised approach could be trained to fit single images now that I have enough training data. Another effective approach would be to utilize many images to remove noise.
Meter logic
Having the needle angles is not enough to read the meter with high precision. Even assuming the absence of noise, at threshold pixel values, needle positions may oscillate. Additionally, position of the test dials may not be correlated to the overall meter reading without counting the number of rotations. Keeping state between images allows enforcement of such invariants as the meter value only increasing. For now, I'll leave the heuristics of this to readers interested enough to take a look at the provided Python code.
Implementation
The code provided here will need minor modifications to any application. It could easily be adapted to read any radial analog meter. Take a look after if __name__ == '__main__' for parameter settings, such as dial centers and radius.
Last Modified: 17 Nov 2009